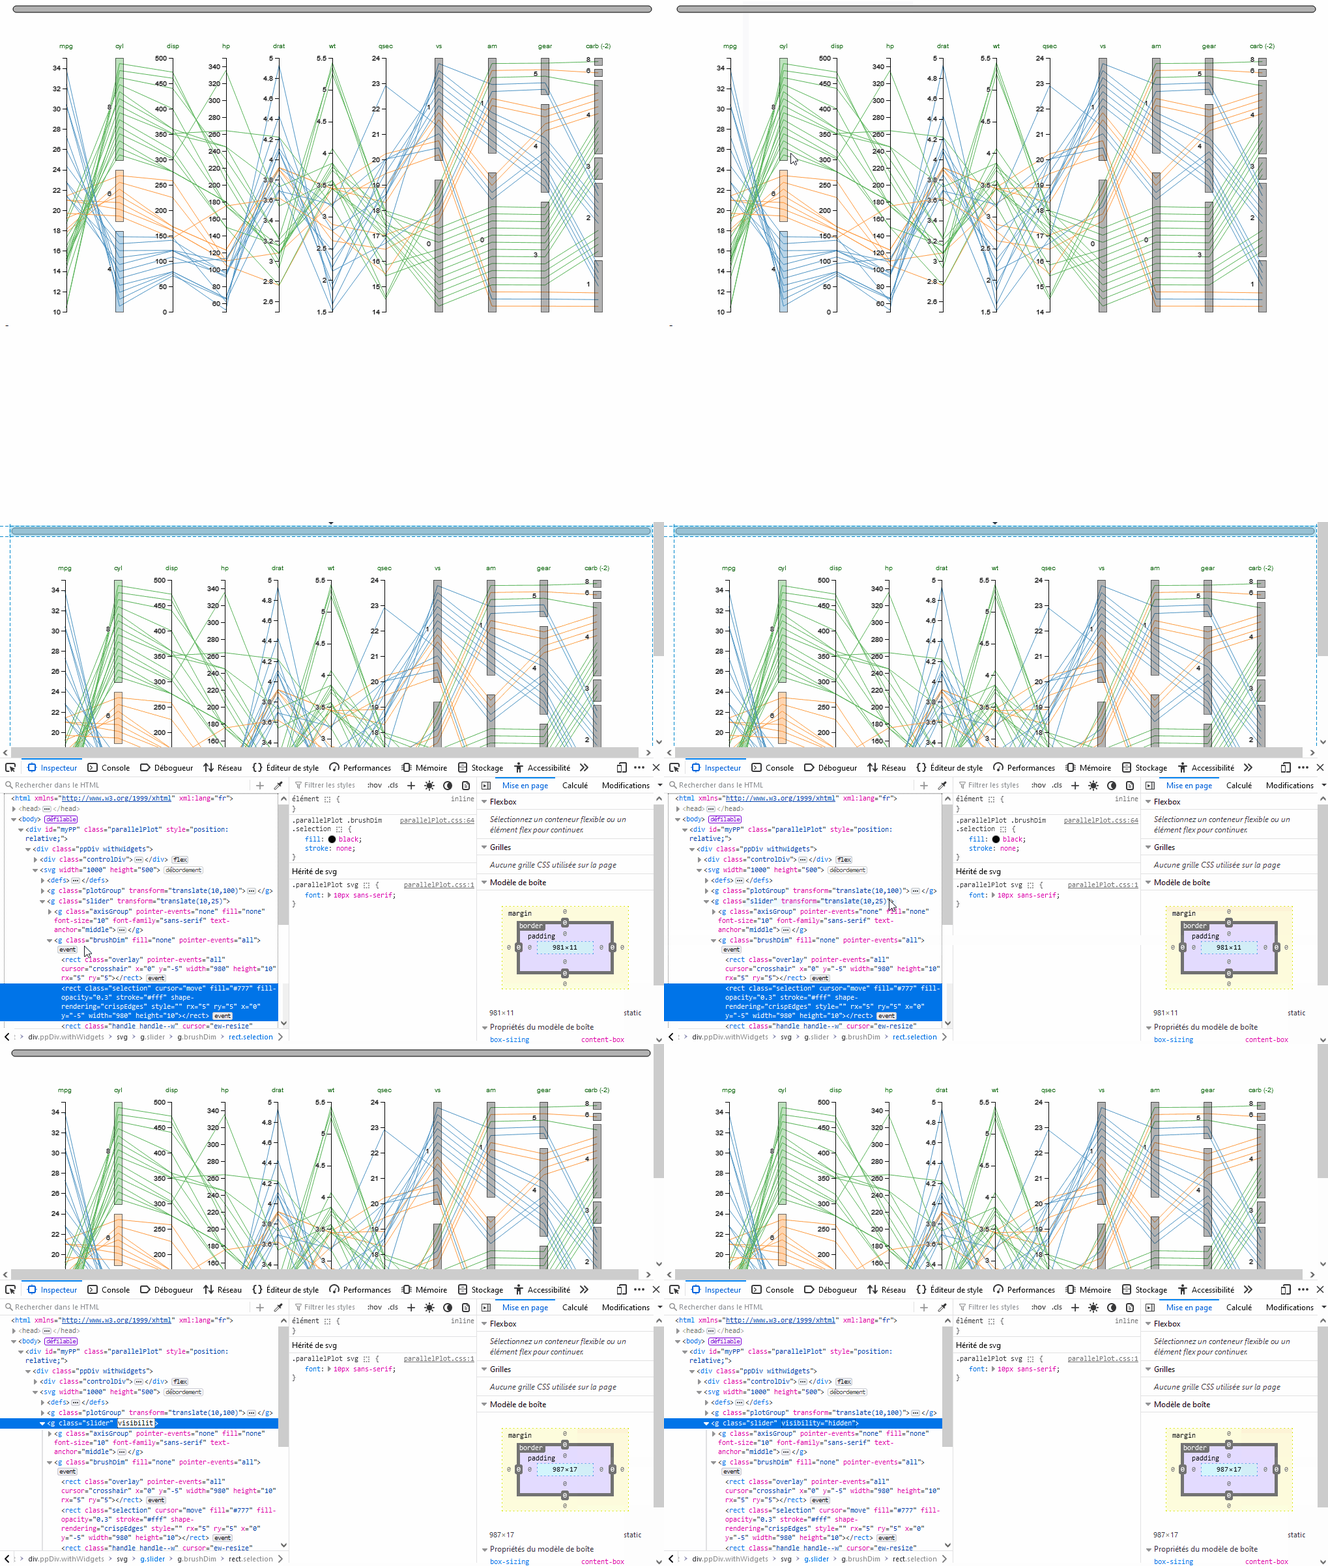
Someone asked me for help styling a parallelPlot using the cssRules argument. In his case, he would like to hide the slider at the top of the chart.
Let’s see how to find the solution following three steps.
Step 1 - Find which CSS rule to use
When we open a parallelPlot from a R console, it’s in fact a HTML page which is created.
HTMLprovides the fundamental building blocks for structuring Web documents and apps.
CSSis used to describe the appearance of Web documents and apps.
https://developer.mozilla.org/en-US/docs/Web
To find which CSS rule to use, we can rely on a search engine. The main keyword to use is css. Searching « css hide element », the first result points to:
https://developer.mozilla.org/en-US/docs/Web/CSS/visibility
Thanks to the « Try it » section, the interesting option seems to be visibility: hidden.
Step 2 - Make some tests to determine where to apply the CSS rule
- download the file mtcars.html and open it with a web browser (firefox will be used here);
- place the mouse pointer hover the part of the graph you want to hide (the top slider) and right click to select « Inspect »;
(note: when the inspector is open, as you move the mouse around the elements listed in theHTMLpane, the corresponding elements are highlighted in the page) - in the
HTMLpane, if this is not already the case, click the element which seems the highest in the hierarchy and which seems to correspond to the top slider; it should be<g class="slider" transform="translate(10,25)">; - right click and select « Attributs/Add attributs » (or double click the
>which is at the end of the line) and typevisibility: hiddenas seen in Step 1. The slider should disappear.

Step 3 - Write a CSS code to use as cssRules argument
CSSis a rule-based language — you define the rules by specifying groups of styles that should be applied to particular elements or groups of elements on your web page.
To learn more about CSS, see https://developer.mozilla.org/en/docs/Learn/CSS/First_steps
The cssRules argument expects a list of CSS rules. A CSS rule has two parts:
-
a
CSSrule opens with a selector.In CSS, selectors are patterns used to match, or select, the elements you want to style.
In our example, we want to select the
HTMLelement<g class="slider" transform="translate(10,25)">.gstands for « group », so we wants to select a group with aclassattribute equals toslider. -
associated to this selector, there are one or more declarations, which take the form of property and value pairs. In our example, we need only one declaration, we want to use
visibility: hidden.
So, in a R console, we can try:
library(parallelPlot)
parallelPlot(iris, cssRules = list("g" = "visibility: hidden"))
But doing so, we hide to many elements, the displayed graph appears empty, all white. We need to use a more discriminating selector by specifying the class of the targeted group. To specify a class, the operator is the dot (to see the list of existing operators: https://developer.mozilla.org/en-US/docs/Web/CSS/CSS_selectors).
In a R console, we can try:
library(parallelPlot)
parallelPlot(iris, cssRules = list("g.slider" = "visibility: hidden"))
Bingo!
This time, only the slider is hidden, while the graph itself is clearly visible.
