Lagun is a Web application based on R/Shiny.
Shiny is an open source R package that provides an elegant and powerful web framework for building web applications using R. Shiny helps you turn your analyses into interactive web applications without requiring HTML, CSS, or JavaScript knowledge.
Many graphs are used in Lagun. Some correspond to graphs provided by the R package plotly. Others, such as parallelPlot and scatterPlotMatrix, have been custom-written (from scratch) especially for Lagun.
These two graphs have been developed as R packages, themselves based on the htmlWidget package.
Widgets created using the framework can be:
- Used at the R console for data analysis just like conventional R plots.
- Seamlessly embedded within R Markdown documents and Shiny web applications.
- Saved as standalone web pages for ad-hoc sharing via email, Dropbox, etc.
So, they can be used outside Lagun (this is the subject of another thread).
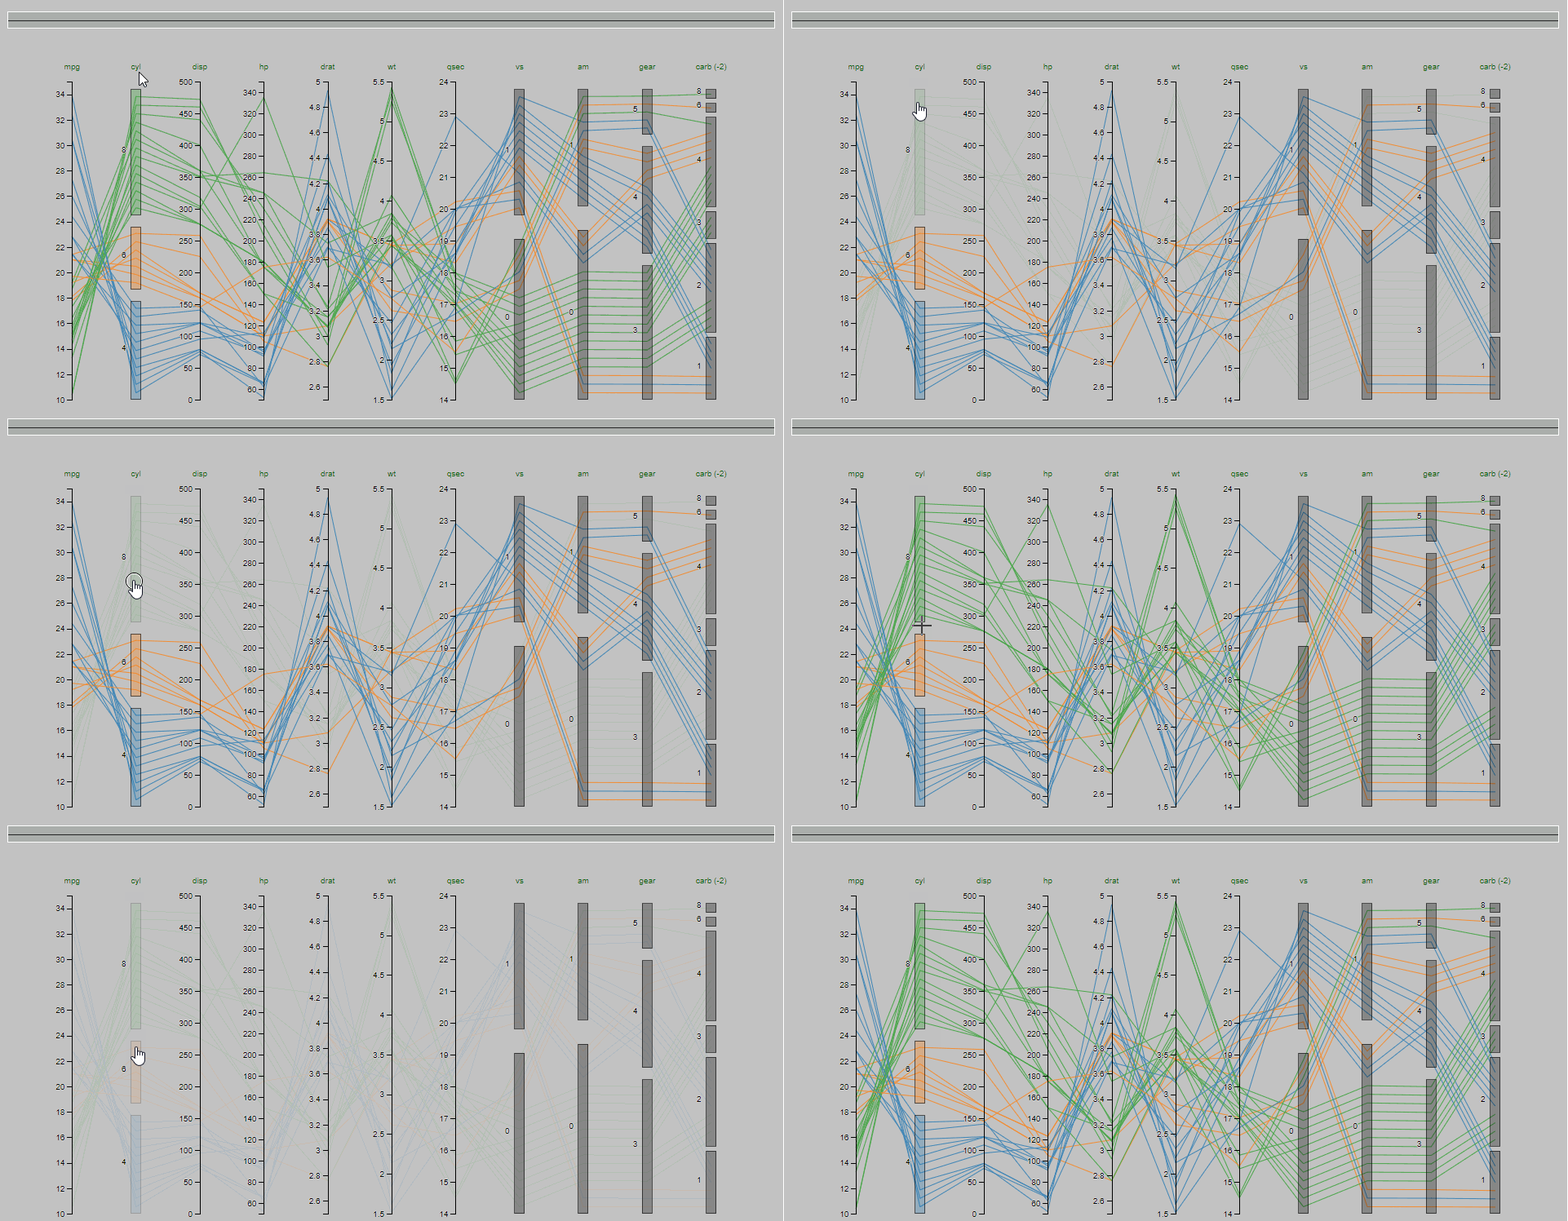
parallelPlot
parallelPlot is a graph with parallel coordinates.
A point in n-dimensional space is represented as a polyline with vertices on the parallel axes; the position of the vertex on the i-th axis corresponds to the i-th coordinate of the point.
Parallel coordinates - Wikipedia
parallelPlot has been published on CRAN: https://cran.r-project.org/package=parallelPlot.

See more images at: https://gitlab.com/drti/parallelplot/-/blob/master/doc/features.md
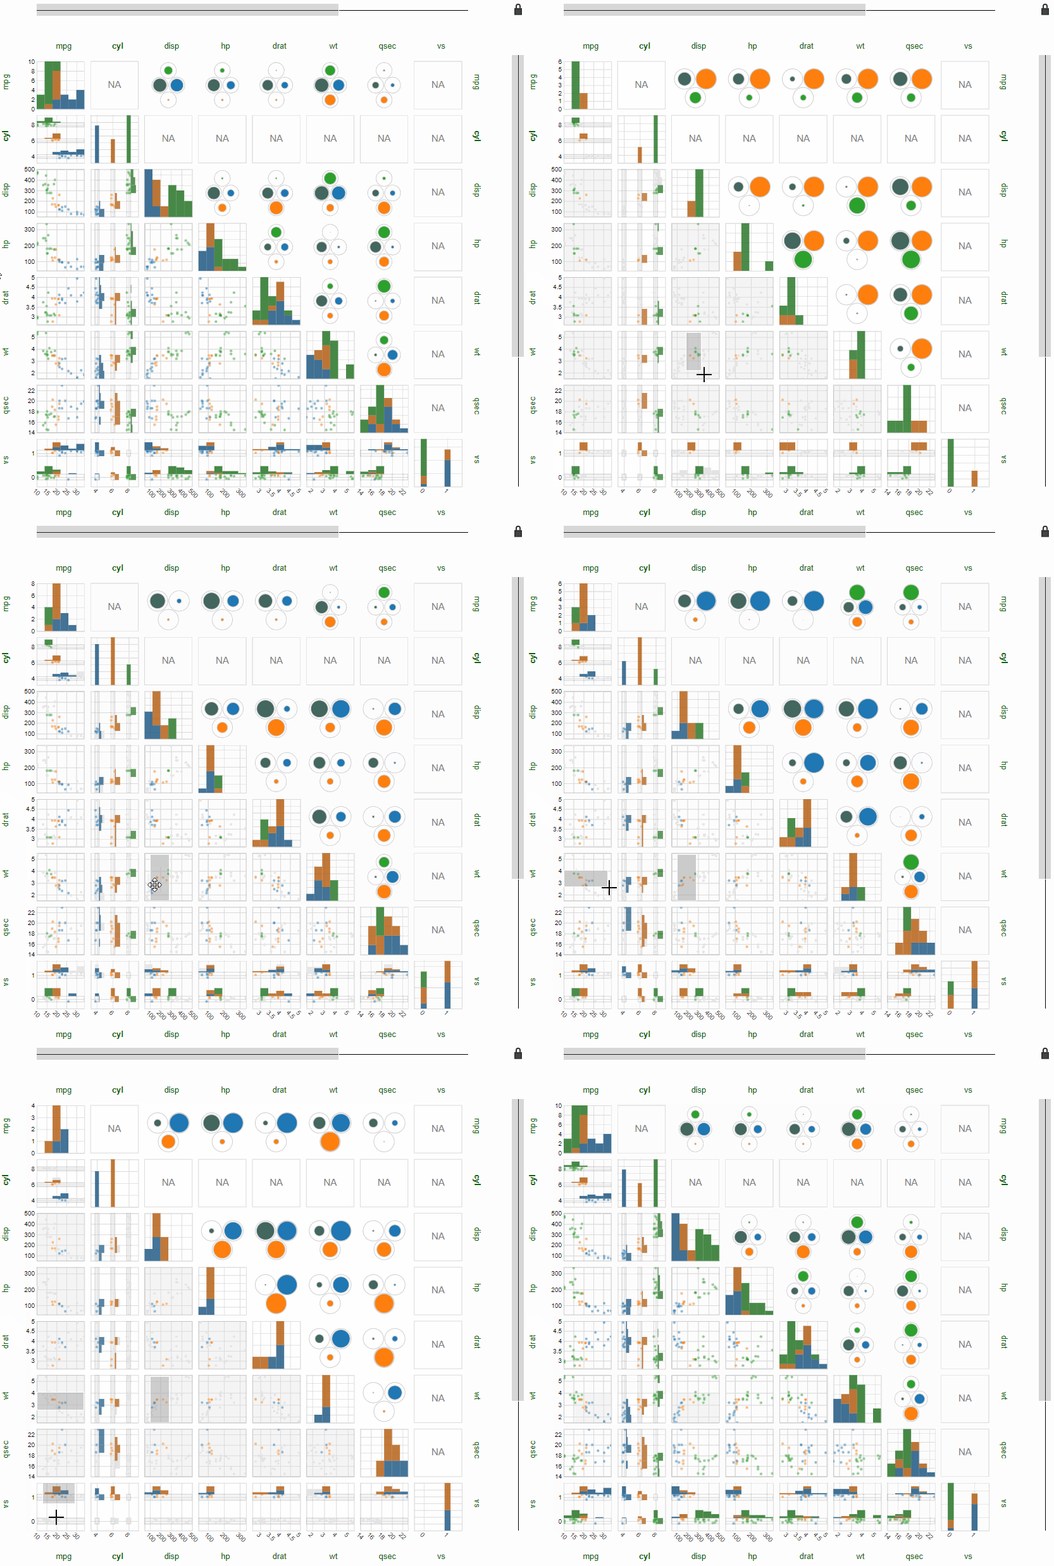
ScatterPlotMatrix
The scatter plot matrix shows all the pairwise scatter plots of the variables on a single view with multiple scatterplots in a matrix format
Scatter plot - Wikipedia
scatterPlotMatrix has been published on CRAN: https://cran.r-project.org/package=scatterPlotMatrix.

See more images at: https://ifpen-gitlab.appcollaboratif.fr/detocs/scatterplotmatrix/-/blob/master/doc/spm-features.md