There are several ways to use parallelPlot and scatterPlopMatrix outside Lagun. Five methods will be discussed in this post.
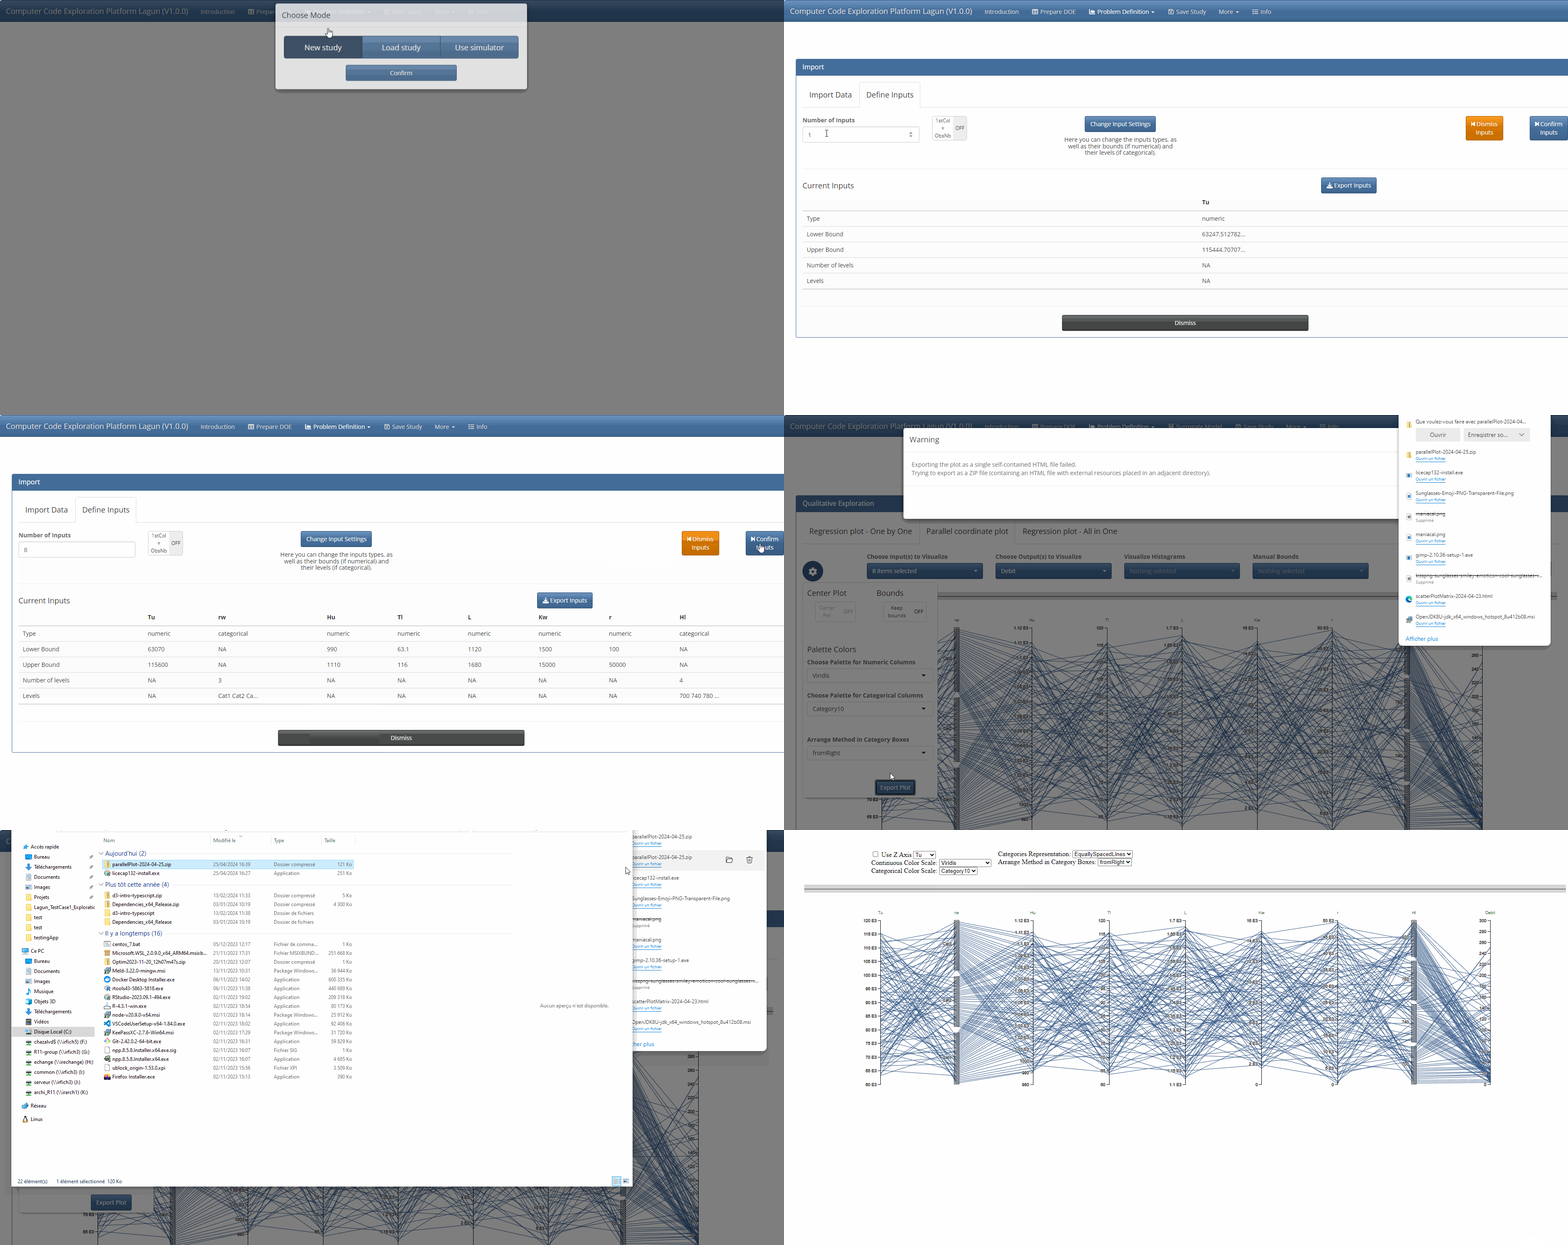
I) From Lagun, export the graph as a stand-alone html file
When one of these graphs is displayed, a button (a gear icon on the top left) is used to open a popup. Then, in the bottom, a button Export Plot allows you to export the plot as a stand-alone html file.
More precisely, exported file can take two forms, depending on what is installed on the server running Lagun:
- the export is a single
htmlfile (this is the case if thepandoclibrary is installed, typically true when using the Lagun docker image); - the export is a
zipfile containing ahtmlfile and its dedicated directory (containing files useful for the proper operation of thehtmlfile).

II) From an R console, display a parallelPlot (or a scatterPlopMatrix)
In a R console:
-
install package
parallelPlot;install.packages('parallelPlot', repos = 'http://cran.us.r-project.org') -
load data to visualize;
myData <- read.csv2('./documentation/test-cases/Lagun_TestCase1_Exploration/DOEXY.csv', header = TRUE, sep = ',') -
display data on a
parallelPlot.categorical <- list(NULL, c("Cat1", "Cat2", "Cat3"), NULL, NULL, NULL, NULL, NULL, c(700, 740, 780, 820), NULL) parallelPlot::parallelPlot(myData, categorical = categorical)
III) From an R console, export the graph as a stand-alone html file
Very similar to the previous case.
In a R console:
-
install package
parallelPlot;install.packages('parallelPlot', repos = 'http://cran.us.r-project.org') -
load data to visualize;
myData <- read.csv2('./documentation/test-cases/Lagun_TestCase1_Exploration/DOEXY.csv', header = TRUE, sep = ',') -
create
parallelPlotwith the loaded data;categorical <- list(NULL, c("Cat1", "Cat2", "Cat3"), NULL, NULL, NULL, NULL, NULL, c(700, 740, 780, 820), NULL) myParallelPlot <- parallelPlot::parallelPlot(myData, categorical = categorical) -
export the created
parallelPlotas ahtmlfile.htmlwidgets::saveWidget(myParallelPlot, 'myParallelPlot.html')
IV) from a Shiny application
You can write a Shiny application which uses parallelPlot and/or scatterPlopMatrix, and interacting with other graphical components. Some examples (used for testing) are available on the gitlab repositories:
- https://gitlab.com/drti/parallelplot/-/tree/master/test/testingApp
- https://ifpen-gitlab.appcollaboratif.fr/detocs/scatterplotmatrix/-/tree/master/test/testingApp
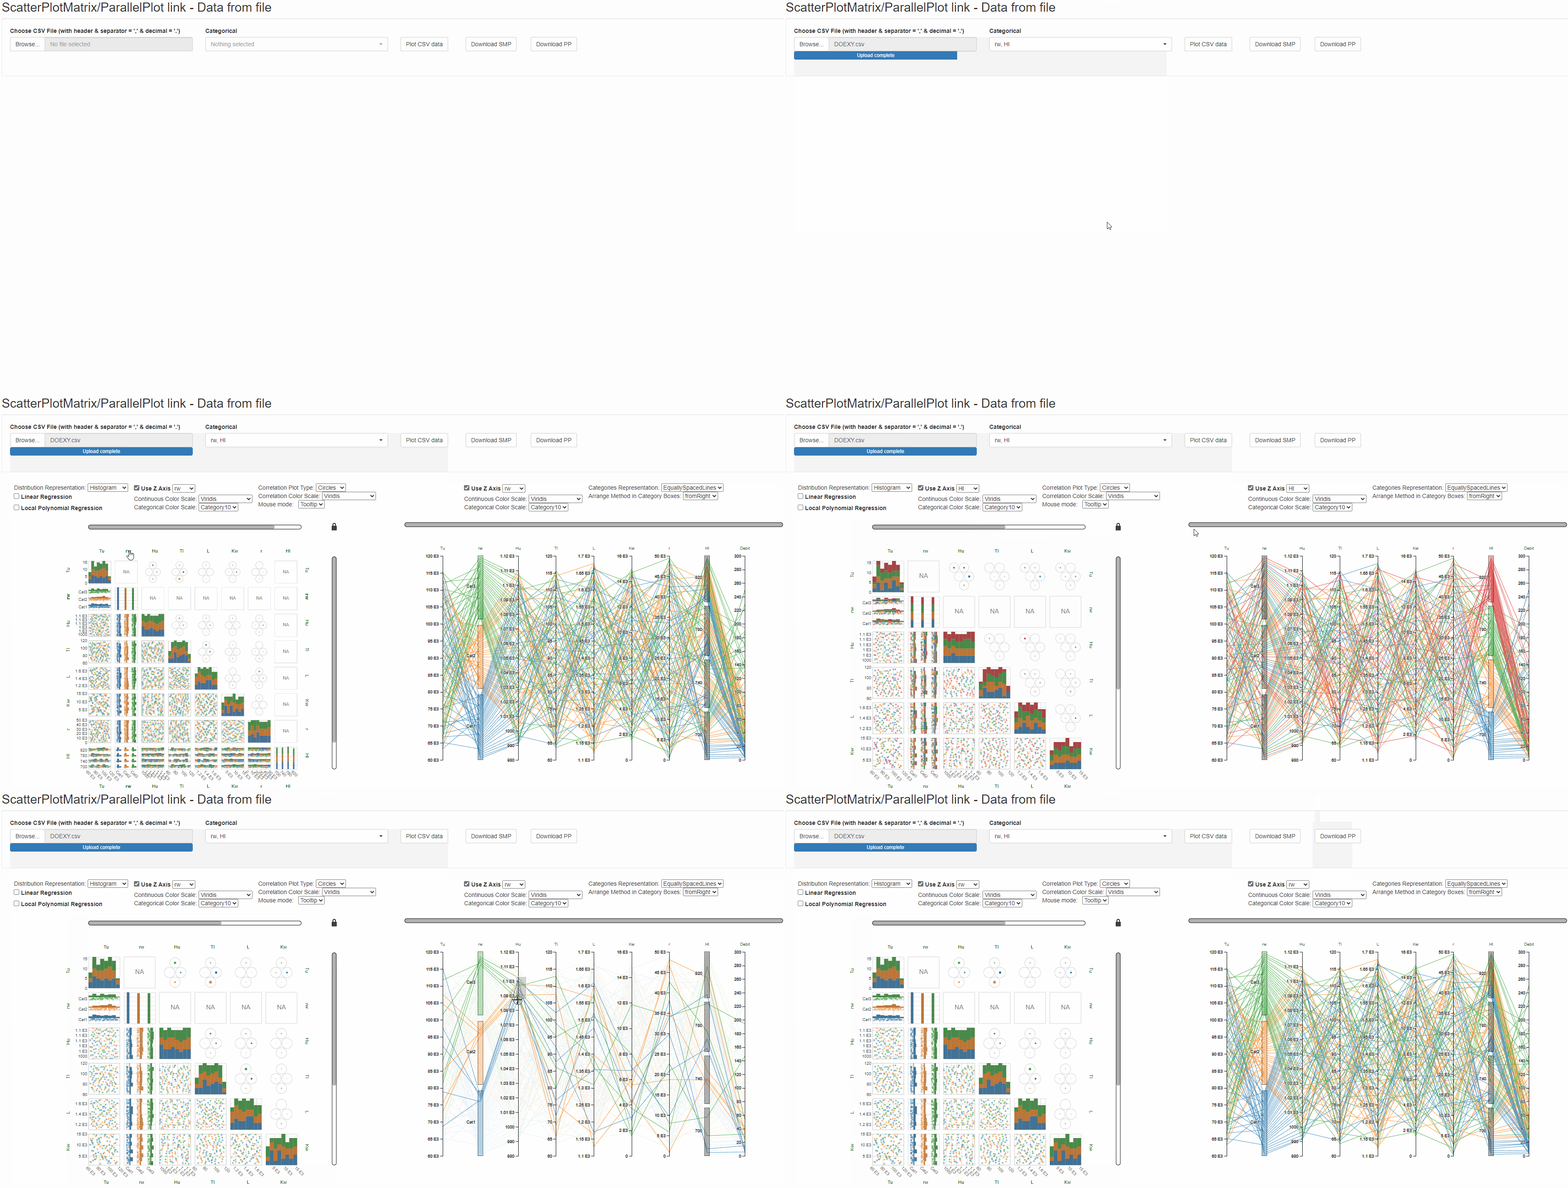
Below, screenshot of Shiny-ScatterPlotMatrix-ParallelPlot-CsvFile.R:

Note you can deploy easily your own Shiny app on the web thanks to https://www.shinyapps.io/. We do this for some testing apps, for example:
https://detocs.shinyapps.io/ScatterPlotMatrix-ParallelPlot-Link-DataFromFile/
V) In your own html page
You can also write a html file which uses parallelPlot and/or scatterPlopMatrix. Some examples (used for testing) are available on the gitlab repositories:
- https://gitlab.com/drti/parallelplot/-/tree/master/test
- https://ifpen-gitlab.appcollaboratif.fr/detocs/scatterplotmatrix/-/tree/master/test
Let’s see the html file called mtcars.html in the parallelPlot repository:
-
it references two external files (parallelPlot.css and pp.iife.js ), make sure they are available in your own
htmlfile; -
data to display are written in the
htmlfile, replace them by your own data keeping the same format (placed between inverted quotes, first row is a header, comma is the column separator);const mtcarsCsv = `model,mpg,cyl,disp,hp,drat,wt,qsec,vs,am,gear,carb Mazda RX4,21,6,160,110,3.9,2.62,16.46,0,1,4,4 Mazda RX4 Wag,21,6,160,110,3.9,2.875,17.02,0,1,4,4 Datsun 710,22.8,4,108,93,3.85,2.32,18.61,1,1,4,1 Hornet 4 Drive,21.4,6,258,110,3.08,3.215,19.44,1,0,3,1 Hornet Sportabout,18.7,8,360,175,3.15,3.44,17.02,0,0,3,2` -
don’t forget to adapt the
configargument to your case, especiallycategoricalandrefColumnDimattributes.const config = { data: mtcars, rowLabels: mtcars.map(row => row.model), categorical: [null, null, [4, 6, 8], null, null, null, null, null, [0, 1], [0, 1], [3, 4, 5], [1, 2, 3, 4, 5, 6, 7, 8]], refColumnDim: "cyl", controlWidgets: true }